SSH (Secure Shell) is the most common remote management protocol for Linux-based systems, routers, switches, firewalls, appliances and other assets. Although the SSH daemon provides excellent hardening to strengthen your authentication methods and access control, SSHD does not however provide native monitoring capabilities.
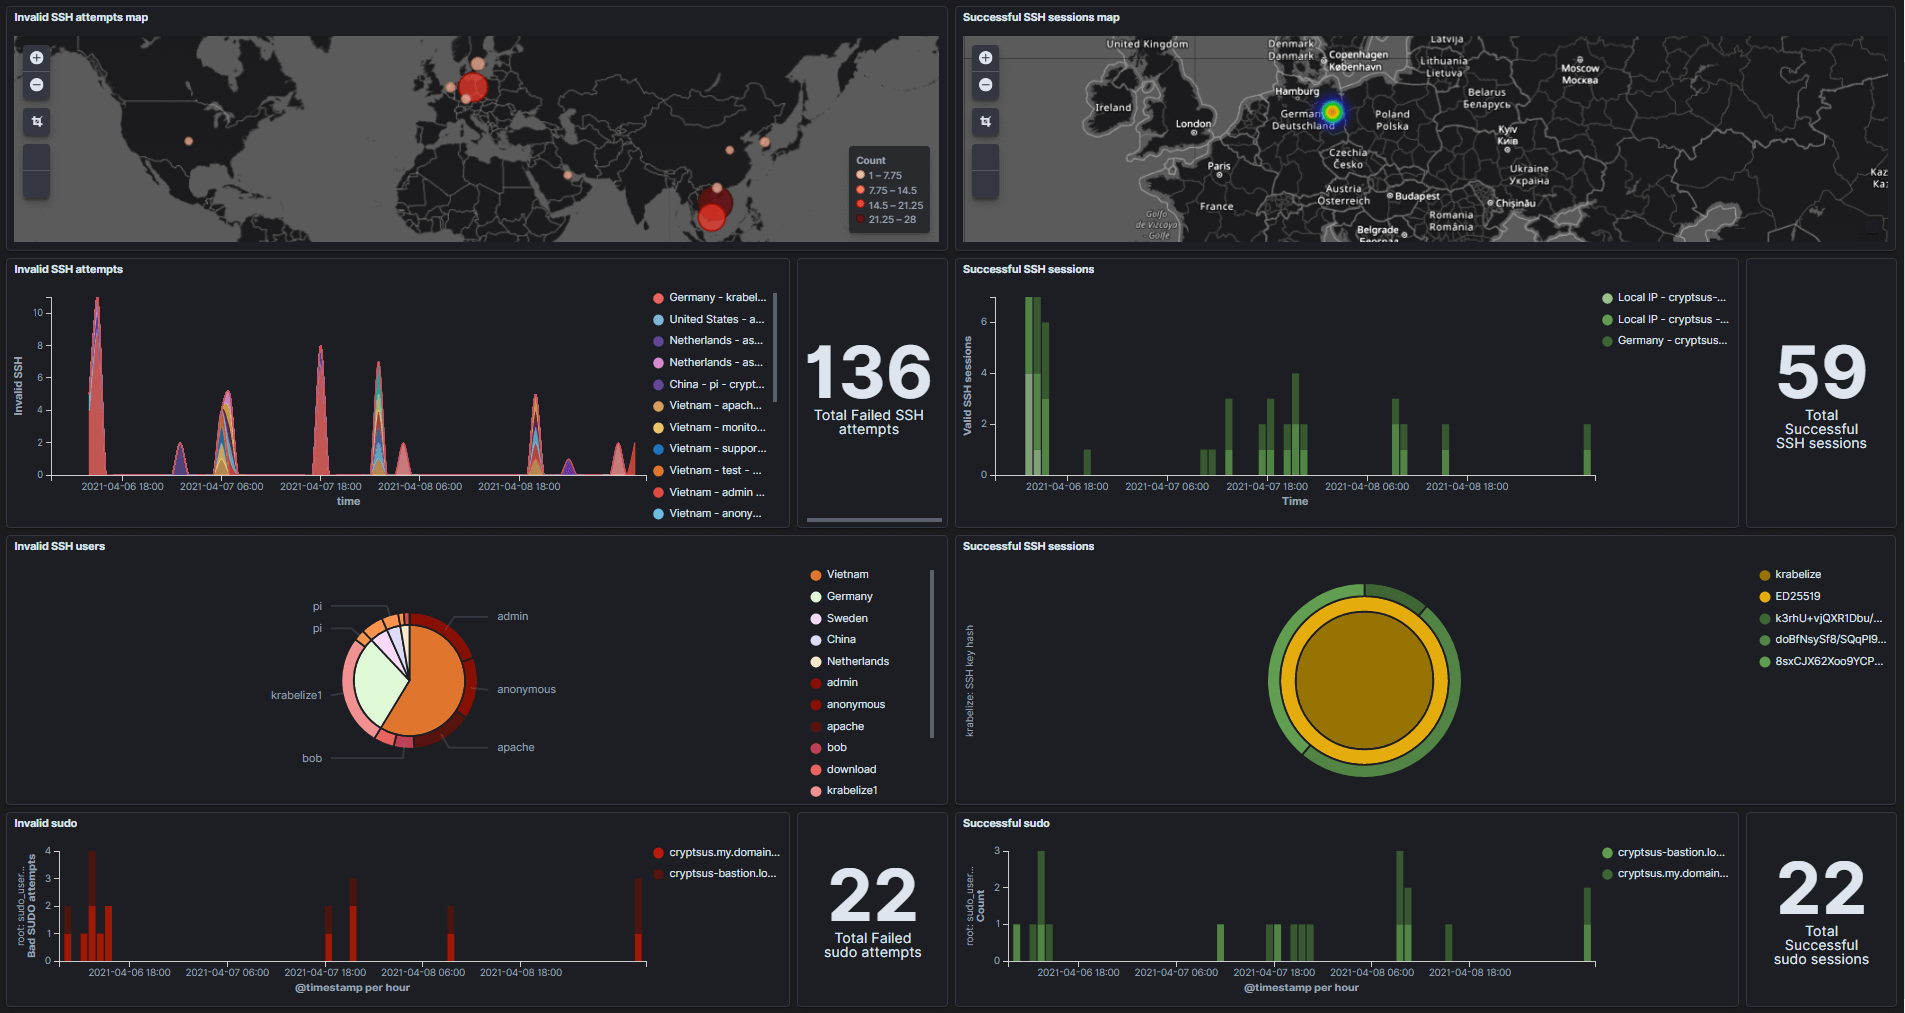
This blog post elaborates on how you can transform SSH log files to a real-time and interactive open source SIEM (Security Information and Event Management) dashboard with Kibana from ELK stack (Elasticsearch, Logstash and Kibana). This way you know who is knocking on your doors and get visibility in your SSH sessions. Figure 1 shows this live dashboard. The left side of this security dashboard shows failed SSH actions, while the right side shows successful SSH sessions:

Figure 1: SSH Security Dashboard
This data and dashboard might be useful in the case of:
- Your SSH key-pair got stolen/copied/cracked and is used to login by a malicious actor.
- A (web application) vulnerability is exploited and a privilege escalation is executed which results in sudo privileges/root access, or a secondary SSH key-pair is generated and configured.
- Parallel attacks are executed on your gateway, management and web/application servers and you want to use SSH and sudo log data to for threat hunting purposes.
- A misconfiguration in the SSHD or sudo configuration allows for rather promiscuous logins and elevations.
Setup
You can either host a centralized Elastic stack yourself or leverage the Elastic stack PaaS from Azure or Elastic Cloud. The latter are in essence cloud native SIEM solutions.
SSHD logs are OS-agnostic, which means the SSH log entries format should be uniformal if you run the OpenBSD version despite if you run Debian, Red Hat or Ubuntu-based system. However, time/date notation might be not be homogeneous and should be normalized in Logstash.
Log data flow pipeline
The SSH log files need to pass a few stations before we get a shiny live security dashboard for monitoring purposes. Figure 2 shows the data flow process for log forwarding, collection, analyzing and visualizing:

Figure 2: Log data flow from SSH source to the SIEM
Step 1: At the source, SSH authentication attempts and sessions activity are automatically appended to the /var/log/authlog log file. This is how the content of the SSH authlog file can look like:
$ tail /var/log/authlog

Apr 15 12:55:28 cryptsus-bastion sshd[25158]: Connection from 61.61.61.61 port 35444 on 209.209.209.209 port 22 rdomain "0"
Apr 15 12:55:58 cryptsus-bastion sshd[25158]: fatal: Timeout before authentication for 61.61.61.61 port 35444
Apr 15 12:56:30 cryptsus-bastion sshd[35310]: Connection from 61.61.61.61 port 13361 on 209.209.209.209 port 22 rdomain "0"
Apr 15 12:56:54 cryptsus-bastion sshd[7145]: Connection from 95.95.95.95 port 10265 on 209.209.209.209 port 22 rdomain "0"
Apr 15 12:56:55 cryptsus-bastion sshd[7145]: Accepted key ED25519 SHA256:doBfNsySf8/sA29ak2aBl29Aksdliuj2923lA23a/G4lcZs found at /home/$USERNAME/.ssh/authorized_keys:3
Apr 15 12:56:55 cryptsus-bastion sshd[7145]: Postponed publickey for krabelize from 95.95.95.95 port 10265 ssh2 [preauth]
Apr 15 12:56:55 cryptsus-bastion sshd[7145]: Accepted key ED25519 SHA256:doBfNsySf8/sA29ak2aBl29Aksdliuj2923lA23a/G4lcZs found at /home/$USERNAME/.ssh/authorized_keys:3
Apr 15 12:56:55 cryptsus-bastion sshd[7145]: Accepted publickey for krabelize from 95.95.95.95 port 10265 ssh2: ED25519 SHA256:doBfNsySf8/sA29ak2aBl29Aksdliuj2923lA23a/G4lcZs
Apr 15 12:56:55 cryptsus-bastion sshd[7145]: User child is on pid 73005
Apr 15 12:56:55 cryptsus-bastion sshd[73005]: Starting session: shell on ttyp0 for krabelize from 95.95.95.95 port 10265 id 0
Step 2: The local rsyslogd daemon (remote syslog) or Filebeat agent forwards every new log entry to the centralized Logstash server, where log traffic over the network is encrypted by TLS in combination with CA certificates and sent over TCP (reliable logging). Rsyslogd is native to Linux, while Filebeat is third-party agent from Elastic which needs to be installed first.
Step 3: Data is normalized with Logstash to a JSON format. We create mapping fields with grok filters to create variables (e.g. translate IPv4 and IPv6 addresses to geo-IP points):
%{MONTH:month}(%{SPACE})?%{MONTHDAY:day} %{TIME:time} %{HOSTNAME:hostname} %{WORD}\[%{NUMBER:ssh_session_id}\]: Invalid user %{USER:ssh_user} from %{IPV4:ssh_source_ip} port %{NUMBER:ssh_source_port}
%{MONTH:month}(%{SPACE})?%{MONTHDAY:day} %{TIME:time} %{HOSTNAME:hostname} %{WORD}\[%{NUMBER:ssh_session_id}\]: %{DATA} %{WORD:ssh_auth_type} for %{USER:ssh_user} from %{IPV4:ssh_source_ip} port %{NUMBER:ssh_source_port} %{NOTSPACE} %{WORD:ssh_key_type} %{NOTSPACE:ssh_hash_type}:%{NOTSPACE:ssh_hash}
%{MONTH:month}(%{SPACE})?%{MONTHDAY:day} %{TIME:time} %{HOSTNAME:hostname} %{WORD}\[%{NUMBER:ssh_session_id}\]: Starting session: shell on %{DATA:ssh_shell} for %{USER:ssh_user} from %{IPV4:ssh_source_ip} port %{NUMBER:ssh_source_port} %{DATA}
%{MONTH:month}(%{SPACE})?%{MONTHDAY:day} %{TIME:time} %{HOSTNAME:hostname} %{DATA} %{USER:user} to %{USER:sudo_user} on %{DATA:ssh_shell}
Step 4: Elasticsearch stores the log entries and allows us to filter on the Logstash variables in order to select only relevant data.
Step 5: We create visualizations with Kibana based on the Elasticsearch search filters and add these visualizations in our SSH security dashboard.
Step 6: Security analysts access the Kibana dashboard by a web-GUI over port 443 or a SSH tunneling or port forwarding. You can also hang flat screens on the walls with live Kibana dashboards as a SOC (Security Operations Center) does.
Because log entries are automatically and autonomously forwarded locally with rsyslog to the centrally managed Elastic stack, malicious activity is also automatically logged and forwarded (unless the network session is hijacked or blocked by this malicious actor). We should use this automatic forwarding mechanism to our advantage. Alerts can be configured if a certain threshold or variables are met, such as a successful malicious login from an unrelated country.
Tip: start with hardening your SSH daemons first, then apply monitoring/SIEM logging filters. This will remove noise and false-positives.
Kibana SSH Security Dashboard
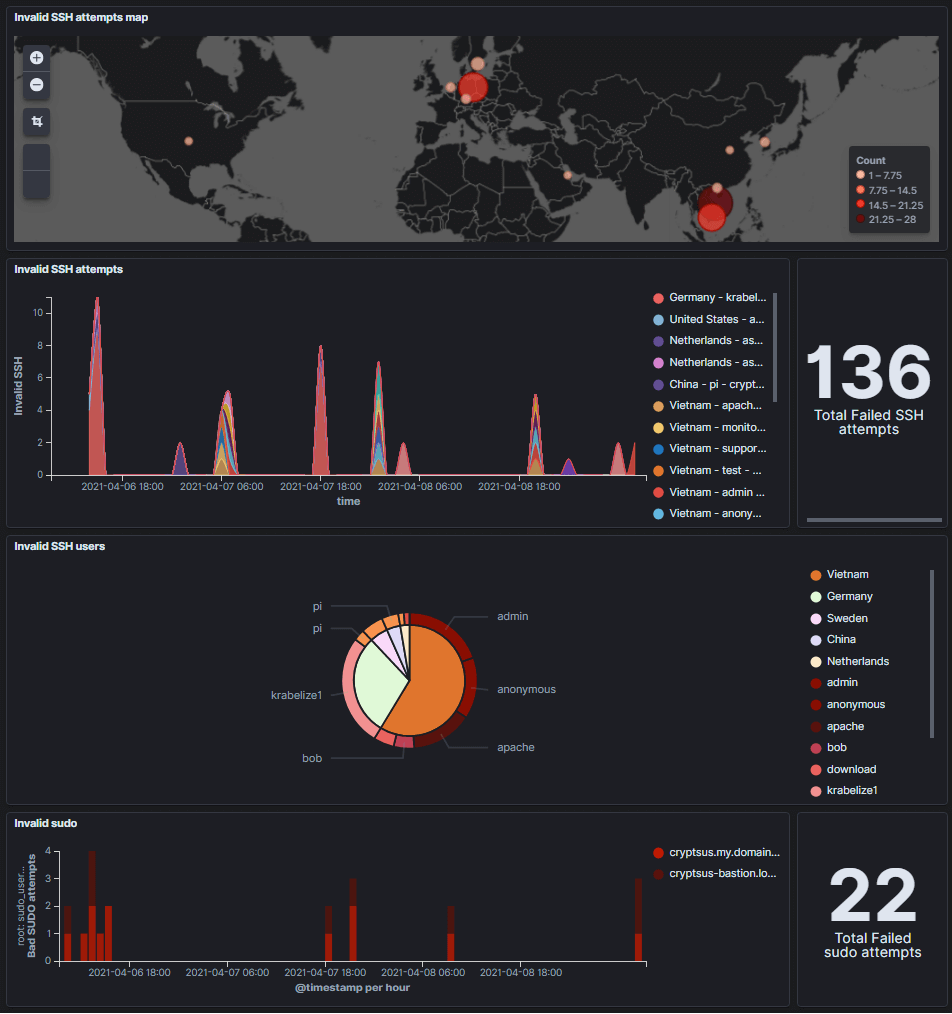
The result is again shown below where we can see from where failed SSH attempts originate from (map 1). Next, we see a timeline of failed SSH attempts sorted by county and date/time. This way we can spot an SSH brute force attack real time and in a glimpse of an eye. You can also use this dashboard for your honeypot system(s).
Next you see a breakdown of the invalid SSH attempts sorted by country and SSH username. This pie chart gives you a better idea of which attack path the attacker is taking.
Lastly we also visualize the failed sudo attempts over time.

Figure 3: Failed SSH sesions in real-time
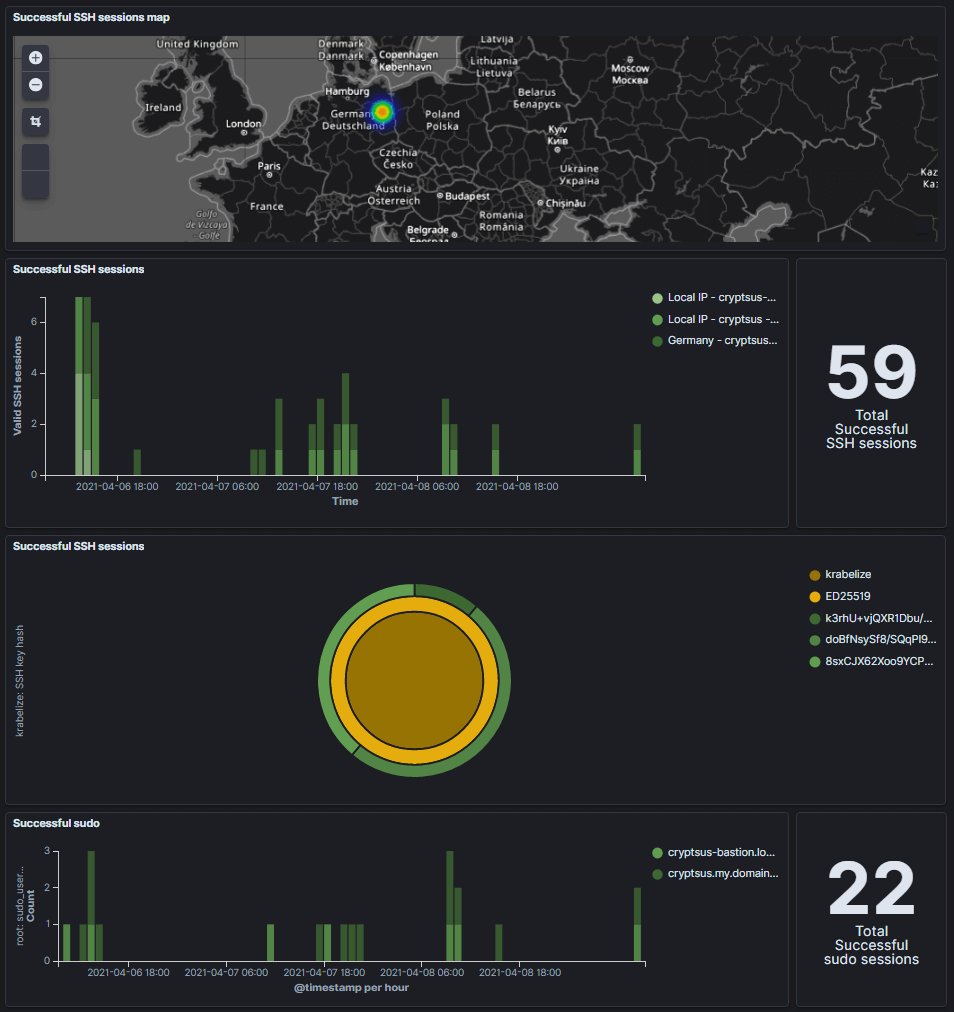
Figure 4 shows the inverse of figure 3, namely successful SSH sessions. This is relevant because you might deduce based on this info false positives and diverted SSH traffic.
Below you can see the geographical IP location of successful logins. Please note that Geo-IP translation is not always accurate and a malicious actor can use serveral methods to hide his real geographical location. Next, you can see which assets passed a successful SSH authentication session and at what date/time.
We are also interested in the SSH authentication method. We can see only SSH public keys were used instead of password authentication. Next, the related SSH fingerprints are displayed for the ed25519 public key.
Lastly, all successful elevated sudo actions are logged. These sudo actions should logically speaking match with the timestamp of a successful SSHD authentication.

Figure 4: Successful SSH sessions in real-time
Now you can correlate and aggregate data from other sources. Gather logging from your web services, databases, firewalls, IDS, HIDS, LDAP/AD servers, AWS/Azure platform and all your other sources. This way you have visibility on your whole IT landscape and you can follow a reconnaissance or even lateral movement by correlating events and data. Happy threat hunting!
Contact us if you need similar insights in your SSH sessions, or any other applications such as your web servers, databases, or even a whole landings platform such as Azure or AWS. We can help you choose, configure and customize the best SIEM setup for your compliance requirements and IT landscape.


